.png)

Key Takeaways
- There is no single Claude SEO playbook for B2B SaaS; your category and competitive position determine your strategy.
- The gap between AI-visible and invisible brands is enormous: from 91% mention rate (enterprise payments) to 0% (billing startups).
- Comparison content ("[leader] vs. [your brand]" and "[leader] alternatives" pages) is the universal lever that works in every single category.
- Third-party presence matters more than owned content alone; brand mentions correlate with AI visibility at 0.664, three times the correlation for backlinks.
- Content format varies by category: tools win in email security, compliance pages win in e-signatures, named authors win in consulting, and pricing specificity wins in payments.
There is no single Claude SEO playbook for B2B SaaS.
We have studied over ten B2B SaaS categories for this guide.
Each one has different competitive dynamics, different content formats, and different platform behaviors. A strategy that makes a payments giant untouchable will do nothing for a billing startup at zero visibility. The technical utility playbook that dominates email security fails completely in CRM. And the comparison content that closes gaps in HR tech barely moves the needle in analytics.
Your category determines your strategy. Copy a dominant brand's playbook when you are invisible, and you will waste a year.
Before we break down each category, find yourself on the spectrum.
The Mention Rate Spectrum: Where You Sit Determines What You Do
The spread between the top and bottom of B2B SaaS is enormous. On one end, an enterprise payment gateway appears in over 90% of competitor-related queries. On the other end, a billing startup registers a flat 0% mention rate across every AI platform we track.
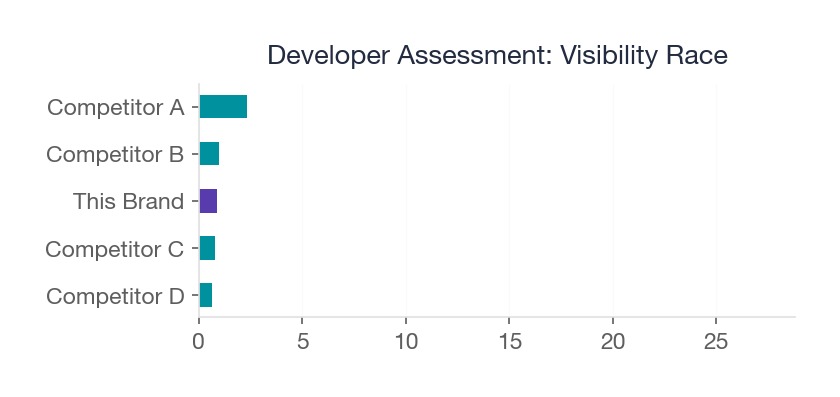
Between those extremes sits every stage of AI visibility. An email security platform in the mid-20s. An HR tech company in the high teens. A developer assessment tool in the mid-teens. A cluster of brands between 4% and 9% still fighting for early traction.
The gap is not just about brand size. It is about content architecture, third-party ecosystems, and how well each brand's content matches what AI platforms actually retrieve for buyer queries.
An Ahrefs study of 75,000 brands confirms this: brand mentions correlate with AI Overview inclusion at 0.664, while backlinks correlate at just 0.218. In other words, being talked about matters three times more than being linked to.
Now here is the part most guides save for the end. We are putting it up front because it is the most important thing in this article.
The Competitive Gap in AI Visibility: Real Category Data
Every category has a different ceiling. Here is how the brands we monitor compare to their category leaders, showing the gap each must close.
The range is striking. In professional services, our client has already achieved near-parity with the category leader. A modest content push could flip the standings. In logistics, the gap is 1.5x. Closable within two quarters with focused effort.
But in email deliverability, the gap is 879x. The brand is invisible while the leader holds 26% visibility. That is not a content optimization problem. That is a foundational visibility problem requiring a complete rethink of content architecture, third-party presence, and brand signal strategy.
The Salesforce ecosystem shows a similar pattern at 86x. When the category incumbent (Salesforce itself) captures 65% visibility, every challenger is fighting for scraps. The winning strategy there is niche specialization, not broad category competition.
Key Metrics Defined
- Mention rate: How often your brand appears in AI responses for relevant category queries, expressed as a percentage.
- Co-mention rate: How often your brand appears alongside a specific competitor in the same AI response.
- Platform spread: The number of AI platforms where your brand appears for a given query.
- Competitive gap: The difference between the category leader’s mention rate and yours.
Matching Strategy to Position
The data across all ten categories points to a clear framework. Find your row, then read the category sections that match your position.
The strategy mismatch is where most teams burn time. An invisible brand publishing thought leadership is shouting into a void. A dominant brand chasing comparison keywords is playing defense it does not need. Match your effort to your position, then let the category playbooks below show you exactly how.
Now let's break down what works in each category.
Email Security: The Technical Utility Playbook
Current Landscape
One DMARC platform built something most content teams would not expect: nearly a thousand cited pages. The vast majority are not blog posts. They are diagnostic tools, error-fix guides, and protocol comparison pages organized into nine topic clusters.
What Makes This Category Unique
The content earning citations is not marketing content. It is technical utility content. A free DMARC checker earns 78 citations across five platforms. Error-fix guides targeting specific SMTP codes earn 49 to 77 citations each. Standard blog posts? Below 10.
That is a 7x to 8x gap between utility content and traditional content marketing. The implication is clear: in technical categories, tools beat articles.
Playbook
- Build free tools first. Diagnostic checkers, validators, and lookup tools generate citations passively because they answer the exact queries buyers type into AI platforms.
- Write error-fix content second. Target specific error codes and protocols. Each one is a high-intent, low-competition entry point.
- Publish comparison pages third. Protocol-vs-protocol and platform-vs-platform comparisons earn steady citations.
- Blog posts are last priority. They have their place, but they are not what AI platforms prefer to cite in this category.
Key Metric to Watch
Citations per tool page vs. citations per blog post. If your tools are not earning 5x or more what your blog generates, you are underinvesting in utility content.
E-Signatures: Competing in the Category Leader's Shadow
The technical utility playbook that works for email security fails here. E-signatures are about trust, compliance, and appearing alongside the incumbent.
Current Landscape
A mid-market e-signature platform sits at about 5% mention rate. The category leader dominates at over 33%. With only a few hundred owned citations from around 138 URLs, a frontal assault on brand awareness will not close that gap.
What Makes This Category Unique
The challenger's compliance-related content earns a mention rate nearly 7x higher than their overall category performance. That is a niche worth owning.
The URL-level data tells the story:
A HIPAA page targeting a tiny audience earns 21 citations across five platforms. That is the power of high-specificity compliance content at the decision stage. It answers questions that general-purpose content cannot.
Playbook
- Comparison content positions you alongside the leader. When buyers ask AI platforms about alternatives, you need to appear in that answer. Every "[leader] vs. [your brand]" page is a new citation opportunity.
- Compliance niche content targets specific regulatory needs. HIPAA, SOC 2, GDPR. Each regulation is a wedge into a segment the leader may not own as deeply.
- You do not need to beat the category leader. You need to appear every time they do.
Key Metric to Watch
Co-mention rate. How often does your brand appear in the same AI response as the category leader? That number matters more than your standalone mention rate.
HR Tech/EOR: A Closable Gap
The comparison-heavy approach of e-signatures scales up dramatically in HR tech, where AI platforms already generate "Brand A vs. Brand B" answers as a default response pattern.
Current Landscape
In the employer-of-record space, one HR tech company holds a mention rate in the high teens against its leading competitor in the low twenties. That is roughly a 2x gap. It is one of the most closable competitive positions we track.
What Makes This Category Unique
AI platforms frequently generate "Brand A vs. Brand B" answers for employer-of-record queries. Every comparison page the challenger publishes is a chance to appear in the same answer as the leader.
But there is a vulnerability worth noting. When customer support sentiment runs heavily negative, AI platforms pick up that signal from reviews and community discussions. You cannot content-market your way past consistently poor reviews. Fixing the product problem matters as much as fixing the content problem.
Playbook
- Feature-by-feature comparisons with quantified differentiators. Not "we're better." Instead: "We process payroll in 12 countries. They process in 8."
- Address known weaknesses head-on in content rather than ignoring them. AI platforms surface sentiment data. If you pretend a problem does not exist, reviewers will make sure Claude knows it does.
- Build review volume to dilute negative sentiment signals. This is not gaming the system. It is ensuring your full customer base is represented, not just the frustrated vocal minority.
Key Metric to Watch
Sentiment ratio in AI responses. Track what Claude says about your brand's strengths and weaknesses. If negatives dominate, no amount of content will fix your mention rate.
Developer Tools: Platform-Specific Opportunity
The comparison content that closes gaps in HR tech works differently here. Developer tool queries are highly specific, and the platform distribution is uneven, which creates targeted openings.
Current Landscape
A developer assessment platform sits at about 15% mention rate, while the category leader holds around 23%. That is a 1.6x gap, closable with disciplined content production.
What Makes This Category Unique
The platform data reveals an opportunity most teams miss. Google AI Mode gives this challenger its strongest visibility, above 22%. Developer tool queries are highly specific and comparison-oriented. Every comparison page you publish creates a new entry point into AI answers.
This is where the Ahrefs correlation data becomes actionable. Brand mentions correlate with AI visibility at 0.664 across 75,000 brands. For developer tools, that means getting mentioned in Stack Overflow threads, GitHub discussions, and dev community posts matters more than building backlinks.
Playbook
- Focus on head-to-head comparisons for specific use cases: hiring assessments, coding challenges, technical interviews. Generic "top 10" lists will not break through.
- Double down on Google AI Mode optimization since that is where this category shows strongest results.
- Build technical content attributed to named developers with GitHub profiles. AI platforms weight practitioner authorship heavily in developer categories.
Key Metric to Watch
Platform-specific mention rates. If one platform gives you 22% and another gives you 5%, concentrate your effort where you are gaining ground.
Restaurant Tech: Starting From Behind
The platform-specific approach that works in developer tools applies here too, but with a critical difference: one platform is dramatically underperforming.
Current Landscape
A restaurant tech challenger holds about 8.5% mention rate against a category leader above 18%. But the real problem is not the overall gap. It is the platform distribution. Claude visibility sits below 1% for the challenger. That is their worst platform by far.
The good news: mentions are growing, with a positive delta over the tracking period. They are gaining ground, but from a very low base.
A restaurant tech platform in our Slate monitoring data reinforces this pattern. It holds 8.5% mention rate with 70% positive sentiment and showed explosive citation growth from 16 to 499 weekly citations over 90 days. That kind of trajectory proves the gap is closable, but only if you diagnose and fix platform-specific weaknesses.
What Makes This Category Unique
Claude specifically underperforms for restaurant tech challengers. This is often a content format problem. Claude favors structured data and answer-first formatting. If your content buries the answer three paragraphs deep, Claude skips it.
Playbook
- Diagnose why Claude specifically underperforms. Run your top 20 category queries in Claude and log where competitors appear instead of you.
- Check whether your content lacks the structured data and answer-first format Claude favors. Restructure existing pages before creating new ones.
- Build comparison content targeting "best restaurant POS" and "[leader name] alternatives" query clusters.
Key Metric to Watch
Claude-specific mention rate vs. your cross-platform average. If there is a gap larger than 5 percentage points, you have a format problem, not a content volume problem.
Payments: Defending Dominance
Everything changes at the top. The playbooks above are about climbing. This one is about staying.
Current Landscape
One enterprise payment gateway is the most dominant brand we track in any B2B SaaS category. They appear in over 91% of competitor-related queries, with thousands of unique cited URLs generating tens of thousands of owned citations. That is near-total category ownership.
What Makes This Category Unique
Their citation profile explains why they dominate. Product and pricing pages with specific fee breakdowns lead. A pricing page alone earns over 2,600 citations because it answers the exact question buyers ask AI platforms: "What are the fees?" Concrete, citable numbers.
Their payment gateway overview page earns over 2,000 citations. A pricing blog, success rate optimization guide, and MDR explainer form a strong second tier.
The lesson: specificity is the moat. Generic product marketing does not earn citations. Exact numbers do.
Playbook
- Your threat is not a competitor outpublishing you. It is a competitor publishing more precise, more data-rich content on the same topics.
- Defend by maintaining the most current, most specific data on your own product. The moment a competitor's pricing page is more detailed than yours, you have created an opening.
- Update pricing, fee structures, and technical specs quarterly at minimum. Stale data is a vulnerability.
Key Metric to Watch
Content freshness vs. competitor content freshness on the same topics. If a challenger's pricing page is newer and more detailed, your 91% will erode.
Workflow Automation: Early-Stage Momentum
Current Landscape
A workflow automation brand sits just above 4% mention rate overall. Claude is their strongest platform. Over 90 days, they improved from under 0.2% to nearly 1% visibility. That is a 5x increase from a tiny base.
What Makes This Category Unique
This is what early traction looks like. The brand is not yet competing for category leadership. It is competing for existence in AI responses.
Playbook
- Concentrate effort on the platform where you are gaining ground fastest rather than spreading resources across all platforms. If Claude is working, feed Claude.
- Build category education content: "best workflow automation tools," "how to choose a workflow platform." Your goal is category awareness before brand preference.
- Target the leader's name directly. "[Leader] alternatives" pages are your fastest path to co-mentions.
Key Metric to Watch
Week-over-week visibility trend on your strongest platform. At this stage, trajectory matters more than absolute numbers.
AI Consulting: The Named Expert Advantage
Current Landscape
An AI consulting firm holds about 8% mention rate. A global consultancy leads the category above 16%.
What Makes This Category Unique
AI platforms cite named practitioners, not just firm names. This is the only category where individual author identity consistently outweighs domain authority.
Investing in two to three named thought leaders whose bylines AI platforms associate with specific expertise delivers more than publishing more content under a generic "Team" byline. The Ahrefs brand mention correlation (0.664) applies at the individual level here. A practitioner mentioned by name across industry discussions will pull the firm into AI responses.
Playbook
- Identify two to three practitioners and build their personal citation footprint. Guest posts, podcast appearances, conference talks, and LinkedIn thought leadership all contribute.
- Attribute all content to named authors with visible credentials.
- Target specific expertise niches rather than broad "AI consulting" positioning.
Key Metric to Watch
Named practitioner mention rate vs. firm-level mention rate. If the firm is invisible but a practitioner is cited, you have a branding gap to close.
CRM and Sales Tech: The Comparison Content Battleground
The named-expert approach that works in consulting fails here. CRM is a category where the incumbents have near-permanent mindshare. Breaking in requires a wedge, not a megaphone.
Current Landscape
CRM is one of the most AI-cited B2B SaaS categories. HubSpot and Salesforce dominate AI mentions across every platform we track. Claude already has strong opinions here.
What Makes This Category Unique
The challenge for non-incumbents: breaking in requires a wedge strategy, not a frontal assault. Claude does not need another CRM overview. It needs reasons to mention your CRM for a specific use case.
Playbook
- Comparison content is the entry point. "[Your CRM] vs HubSpot for [specific use case]" pages earn citations because Claude needs multiple brands for comparison answers.
- Stage-specific positioning wins. "Best CRM for seed-stage startups" targets queries where the giants cannot dominate.
- Integration documentation is your differentiation signal. Claude often cites technical integration content for CRM compatibility queries.
- ROI calculators with embedded schema earn citations at rates far exceeding blog posts. This echoes the email security finding: utility content outperforms narrative content across categories.
Key Metric to Watch
Mention rate for niche queries vs. broad category queries. If you appear for "best CRM for seed-stage startups" but not "best CRM," that is progress, not failure.
Marketing Automation and Demand Gen: Where Educational Content Wins
Current Landscape
Demand gen marketers are power users of AI research tools. The content that earns citations goes beyond the product. It explains the discipline.
Our own Slate data tells the story. In SaaS marketing topic clusters, the entities earning highest visibility publish methodology-driven content. TripleDart, iPullRank, Omniscient Digital, Single Grain. Not product vendors pushing feature lists.
What Makes This Category Unique
This is the one category where teaching the discipline outperforms selling the product. Buyers are researching processes, not features. The brands that explain "how" earn more citations than the brands that explain "what."
Playbook
- Methodology content outperforms product content. A guide on "how to structure a B2B attribution model" earns more citations than a product comparison page.
- Original benchmark data is the highest-leverage asset. First-party data gives Claude a reason to cite you instead of Gartner. If you have unique numbers, publish them.
- Named framework content compounds. Frameworks spread across sources, and Claude picks up that signal. Create a named methodology and reference it consistently.
- Playbook-style guides with named steps outperform listicles. Demand gen buyers want process, not options.
Key Metric to Watch
Citations from methodology content vs. citations from product content. The ratio tells you whether you are building a thought leadership moat or just adding to the noise.
Analytics and Business Intelligence: Technical Depth as Currency
Current Landscape
Analytics buyers are the most technical audience in B2B SaaS. This category rewards depth over breadth, and practitioner credibility over brand authority.
What Makes This Category Unique
Named-author technical content from practitioners carries outsized weight. A tutorial written by a data engineer with visible credentials earns more citations than the same content published under a company byline. This parallels the AI consulting finding but applies to written technical content rather than thought leadership.
Playbook
- Technical tutorials with actual query examples and code snippets are what Claude cites for implementation questions. Abstract overviews get ignored.
- Comparative capability matrices work because analytics buyers are comparison-oriented. Structure them as tables, not paragraphs.
- "SQL vs. no-code" framing captures a high-volume query pattern in this category.
- Use-case-specific implementation guides beat generic overviews. "How to build a churn dashboard in [tool]" outperforms "Top BI tools for SaaS."
Key Metric to Watch
The competitive opening for challengers is use-case specificity and practitioner authorship. Track citations by author. If your named practitioner content outperforms anonymous content by 3x or more, you have found your lever.
Billing/CPQ: Starting From Zero
Current Landscape
One billing platform has a 0% mention rate. A well-known subscription management platform leads the category near 20%. That is complete invisibility.
An email outreach platform we monitor in Slate data shows a similar pattern: 0.03% mention rate with zero owned citations, and 14% of all citations going to competitors. When your competitor's domain generates more citations than yours in your own category, you are fighting with one hand tied.
What Makes This Category Unique
When you are at zero, the rules change. You are not optimizing for better rankings. You are trying to get AI platforms to learn that you exist at all. This is the most fundamental challenge in Claude SEO, and it requires the most disciplined approach.
Playbook
- Do not try to compete on branded queries. You will not win them yet.
- Build comparison and category-education content: "Best billing platforms for SaaS," "[leader] alternatives," "How to choose a CPQ tool."
- Your goal is not brand preference. It is category awareness. AI platforms need to learn that you exist before they can recommend you.
- Get mentioned on third-party sites. The Ahrefs correlation data (0.664 for brand mentions vs. 0.218 for backlinks across 75,000 brands) confirms that being talked about on other domains is the fastest path out of zero.
Key Metric to Watch
First citation. Literally. Track the date you first appear in any AI platform response. That is your baseline. From there, track weekly citation count. Going from 0 to 1 is harder than going from 1 to 50.
Content Templates for Early-Stage Categories
For categories like Billing/CPQ and Workflow Automation where AI visibility is still forming, focus on category education content:
- "Best [Category] Platforms for [Use Case]": A comparison page targeting the query buyers actually type.
- "[Category] vs. [Category]: What B2B Teams Need to Know": A definitional page that helps AI platforms understand your category.
- "How to Choose a [Category] Tool: Evaluation Framework": A utility page with specific criteria and scoring that AI can extract.
Logistics SaaS: Steady Visibility Gains
A logistics SaaS platform we track in Slate data holds 10.3% mention rate with visibility improving from 1% to 4.5% over four weeks. This trajectory, a 50% improvement in under a month, shows what consistent category content production looks like in a less crowded vertical.
Playbook
- Target comparison queries for logistics-specific use cases: route optimization, fleet management, warehouse automation.
- Publish integration guides with ERP and supply chain platforms. These technical pages earn citations in logistics the same way pricing pages earn citations in payments.
- The less crowded the category, the faster you can move. Logistics does not have a 91% dominant player blocking the path.
Key Metric to Watch
Monthly visibility trend. In emerging categories, a 50% improvement over four weeks signals strong content-market fit.
Strategy by Visibility Level: Quick Reference
Invisible brands (0 to 2% mention rate):
- Build comparison content targeting the category leader’s alternatives.
- Create 3 to 5 tool or utility pages with specific, extractable data.
- Focus on niche queries where the leader has not invested.
Emerging brands (2 to 5% mention rate):
- Expand topic clusters to cover 5+ subtopics per core category.
- Build third-party presence on Reddit, G2, and YouTube.
- Add schema markup to all high-intent pages.
Competitive brands (5 to 12% mention rate):
- Specialize in the subcategory where you have the strongest differentiation.
- Build error-fix and troubleshooting content for your product’s specific use cases.
- Invest in named authorship with verifiable credentials across all content.
The Common Thread Across Every Category
Ten categories. Ten different playbooks. But three patterns hold everywhere.
Comparison content works in every single category. Whether you are an invisible billing startup or a competitive HR tech challenger, "[leader] vs. [your brand]" and "[leader] alternatives" pages are the fastest path into AI responses. This is the universal lever.
Third-party presence matters more than owned content alone. The Ahrefs study of 75,000 brands shows brand mentions correlate with AI visibility at 0.664, three times the correlation for backlinks (0.218). Getting talked about on other sites, in reviews, in community discussions, in comparison articles, amplifies everything you publish on your own domain.
Content format varies by category. Tools win in email security. Compliance pages win in e-signatures. Named authors win in consulting and analytics. Pricing specificity wins in payments. Methodology content wins in demand gen. There is no universal format. The format that earns citations depends on how buyers research in your category.
Your category determines your strategy. Your competitive position determines your priorities. And the window to build AI visibility at low cost is still open.
TripleDart has built category-specific Claude SEO strategies across payments, email security, HR tech, developer tools, restaurant tech, and more. We track AI visibility across six platforms and build the content architectures that move brands from invisible to cited.
Book a meeting with our team here
Frequently Asked Questions
Does Claude SEO strategy vary by SaaS category?
Yes, significantly. Mention rates, citation sources, and effective content formats vary based on how buyers research in each space. Email security rewards free tools. E-signatures reward compliance content. Payments reward pricing specificity. One playbook cannot cover all three.
Which categories perform best in Claude citations?
Payments and developer tools have the highest citation volumes due to query specificity and strong third-party ecosystems. But "best" depends on your position. A 15% mention rate in developer tools may be harder to achieve than a 15% rate in logistics, where competition is thinner.
What is a realistic mention rate benchmark?
The median sits around 9%. Above 20% is strong. Category leaders in high-volume spaces reach 30-40%. But the number that matters most is your gap to the category leader, not your absolute rate.
Can challengers close the gap on category leaders?
Yes, and faster than in traditional SEO. The citation ecosystem is still being built. Brands that invest now in comparison content and third-party presence can close gaps that would take years to close in organic search.
Does compliance content (HIPAA, SOC 2) perform well?
Consistently yes. It answers high-specificity questions at the decision stage and earns citations disproportionate to traffic volume. A HIPAA-focused e-signature page earning 21 citations across five platforms proves the point.
How do I map my category's citation landscape?
Run 20-30 category-level queries in Claude and log which brands appear, in what context, and from what sources. Then run the same queries in ChatGPT, Perplexity, and Google AI Mode. The overlap and differences across platforms will reveal your biggest opportunities.


.webp)
.webp)

.png)


.png)


.webp)


.webp)

.webp)


%20(1).png)


.webp)
.webp)
.webp)


%20Ads%20for%20SaaS%202026_%20Types%2C%20Strategies%20%26%20Best%20Practices%20(1).webp)


.png)


.png)


.webp)


![Creating an Enterprise SaaS Marketing Strategy [Based on Industry Insights and Trends in 2026]](https://cdn.prod.website-files.com/632b673b055f4310bdb8637d/6965f37b67d3956f981e65fe_66a22273de11b68303bdd3c7_Creating%2520an%2520Enterprise%2520SaaS%2520Marketing%2520Strategy%2520%255BBased%2520on%2520Industry%2520Insights%2520and%2520Trends%2520in%25202023%255D.png)


.webp)


%20Agencies%20for%20B2B%20SaaS%20Compared%20(2026).webp)

.webp)
%20with%20Hubspot.webp)


.png)


.png)

.png)
.png)
.png)
.png)


.webp)

.webp)
.png)
.png)


.webp)


.png)


.webp)
![How to Measure AEO Success: 12 Metrics Beyond Clicks [2026 Framework]](https://cdn.prod.website-files.com/632b673b055f4310bdb8637d/6a0d664b326187e99b3d5960_6%20-%20The%20Ultimate%20Guide%20to%20Measuring%20AEO%20Success%20in%202026.png)
![7-Step Workflow for AEO-Ready Content [2026 Framework]](https://cdn.prod.website-files.com/632b673b055f4310bdb8637d/6a0d55ea88913ede1d3a7123_5%20-%20Workflows%20for%20Optimized%20AEO-Ready%20Content%20Creation.png)
.png)
![How to Structure Content for AEO and GEO [With Templates]](https://cdn.prod.website-files.com/632b673b055f4310bdb8637d/6a0c6a56eb700472e635ff33_1%20-%20How%20to%20Structure%20%20Content%20for%20AEO%20and%20GEO%20%20Summaries%20(2026).png)


.png)
.png)


.png)

.png)


%2520Agencies%2520(2025).png)

![Top 9 AI SEO Content Generators for 2026 [Ranked & Reviewed]](https://cdn.prod.website-files.com/632b673b055f4310bdb8637d/6858e2c2d1f91a0c0a48811a_ai%20seo%20content%20generator.webp)


.webp)
.webp)


.webp)